Our district changed our professional development/faculty meeting model this year. We’ve always set aside an hour on Tuesday afternoons for faculty meetings. But this year, our students are released an hour earlier every Tuesday than on all other days, allowing for a 2-hour block of professional development time. We no longer have a smattering of in-service days throughout the year as a result.
Last week, I was scheduled to facilitate one hour and our math coordinator, Caitlin Bianchi (@CaitlinBianchi), was scheduled to facilitate the other hour with our third and fourth grade teachers. We decided to join forces and model integration ourselves.
The overall goal was to re-introduce some digital tools that students can use to tell math stories or explain their math thinking. I say re-introduce because it’s one of my goals, as seen in this post, to use what we have, better. The first digital tool we used was GoogleCast so that we could project from a Chromebook rather than the desktop connected to the projector. This was a great way for teachers to see the ease of this process and get ideas for how and why students might share their work.
We revisited Voicethread (we have a school subscription), Screencastify (all students have the lite version as an extension), and Explain Everything (on iPads) as tools that might be used to tell math stories or demonstrate learning. We had examples of student work and examples of each tool being used in this manner. Teachers that have used these tools were asked to share examples as well.
 Teachers were given a large amount of time to delve into one of these tools and try it out themselves. Near the end of the meeting, they were asked to share their thoughts and reflect using Recap. We shared the finished Recap with the whole group so that teachers could see the summary of videos they created.
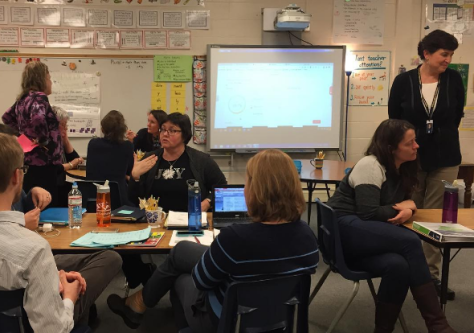
There was a lot of math talk during this meeting. Teachers were engaged for the whole two hours, had hands-on time, reflection time, and time for collaboration. I’ve had a number of people share what they’ve done in their classes as a result of this time. There was positive feedback at the end about the meeting, excitement about integrating these tools, and enthusiastic response about the productive use of time. All in all, technology and math integrated well and was modeled for and with teachers.


